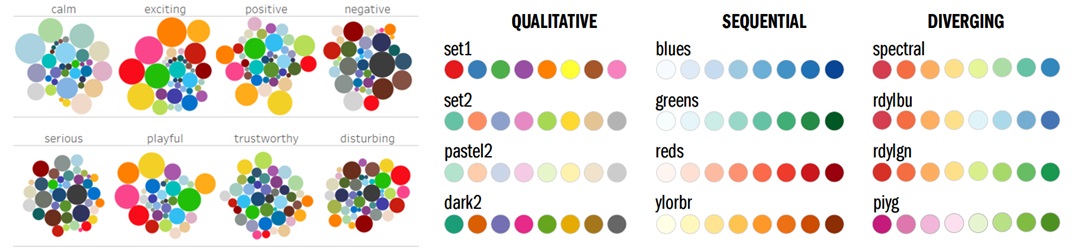
Colors in visualization
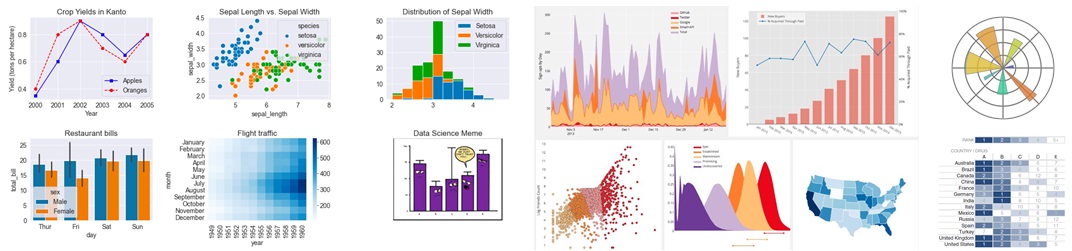
Elementary plots
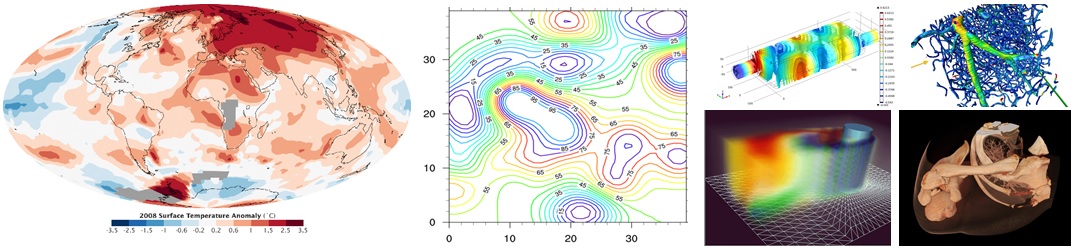
Scalar field visualization
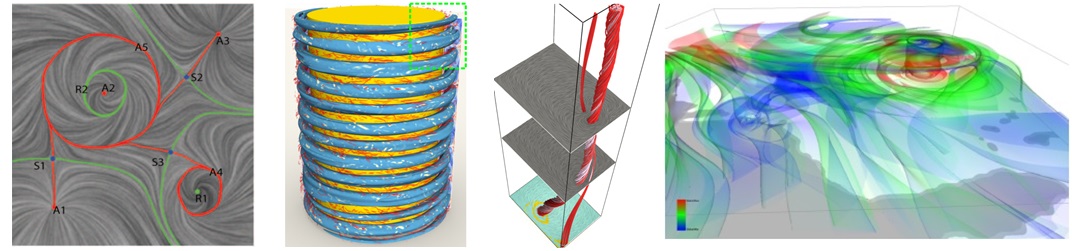
Vector field visualization
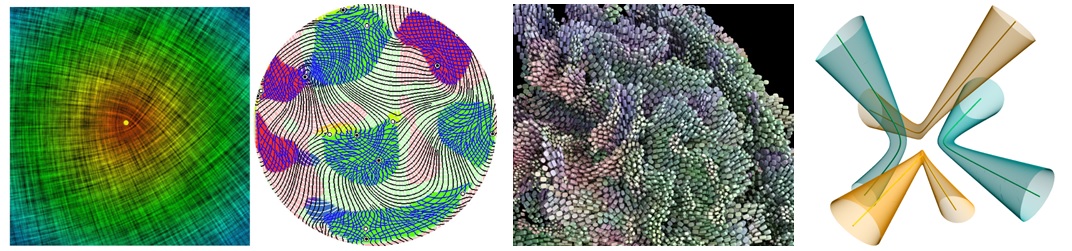
Tensor field visualization
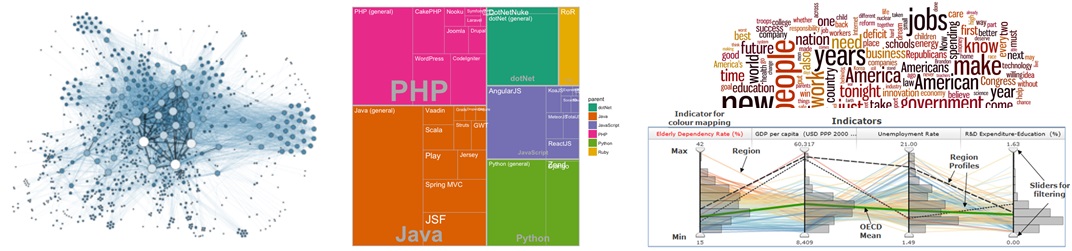
Information data
visualization
TIME: Tu/Th 1~2:30PM
Note that the tentative
format of the course for the first four weeks (August 23 - September
24)
will be hybrid, that is,
face-to-face lecture on every Tuesday at S 114 during the scheduled
meeting time for the course AND remote teaching via Teams on Thursday.
The face-to-face lecturing will be broadcast via Teams for those who
cannot join physically. Further changes will be announced depending on
the update of the
COVID-19 situations.
Visualization
has been established as a powerful means to help domain experts from
various
disciplines or general audience to MAKE SENSE and PRESENT their data,
for
decision making. Techniques and knowledge from different sub-fields of
computer
science (including computer graphics, image processing, data structures
and
algorithms, high performance computing, machine learning, and
human-computer
interaction), mathematics, cognitive and perception science, and
specific
application domains are often adapted for various visualization
problems. This
introductory course covers topics from a number of sub-fields of
visualization
and aims to show students how data visualization can help find
solutions to a
wide range of practical data interpretation problems arising in many
areas.
Through this course, students are expected to (1) get familiar with
important concepts, principles, and techniques/methods for the
visualization of
different types of data, and (2) foster the ability to select the
proper
visualization techniques when given a practical data visualization
problem.
This course serves as one of the core introductory level graduate
courses, and
it helps build a complete course catalog in the direction of visual
computing
with courses like image processing, computer graphics, and computer
vision.
You
are expected to have basics knowledge on linear algebra, linear
systems,
calculus, geometry, numerical analysis, and programming
languages. Homework assignments and course projects will require
knowledge and experience of C++ and/or Python. Visualization Toolkit
(VTK) will be used with either C++ or Python to complete the
programming assignments. You need
to have solid grasp of data structure and algorithm design. Minimal
familiarity
with computer graphics principles and techniques is assumed. Having
taken COSC
6372: Computer Graphics is ideal but not required.
Visualization techniques are highly application dependent and highly
diversified! There is currently no a good texxtbook that can summarize
all
available techniques. However, the following textbooks provide a good
introduction to some well-established techniques for a number of
fundamental
visualization problems.
A student needs
to score on average at least 60% in
total to
pass the class.
Grading scale (tentative): A:
>92%;
A-: >88%; B+: >84%; B: >80%; B-: >74%; C+: >68%; C: >
60%.
| Timeline |
Lectures |
Additional
Reading Materials and Resources |
| Week 1 (08/24, 26) |
Course
introduction, visualization introduction [slides] Visualization pipeline [slides], different data types and data storage [slides] |
|
| Week 2 (08/31, 09/02) | Cognition and
perception, what need to be considered [slides] (Please watch the recording about Gestalt principles on Teams) Elementary plots-principles and practices [slides] (Please watch the recordings for the introduction on some simple plots and a short tutorial for plotting using Python+matplotlib/seaborn on Teams) (Assignment 1 out) [Check the Assignments tab] |
|
| Week 3 (09/07, 09) | Colors in
visualization [slides] VTK introduction [slides] (A simple vtk demo program can be found here. You can run it in Spyder or via command line in the powershell of your conda. You can use the data sets for Assignment 2 for this demo.) |
VTK resources:
|
| Week 4 (09/14, 16) | (Due
to hurricane Nicholas, the lecture on Tuesday 09/14 was canceled) 2D scalar field visualization - color plots [slides] (Assignment 2 out) [Check the Assignments tab] |
|
| Week 5 (09/21, 23) | 2D scalar field
visualization - iso-contours [slides] 3D scalar field visualization - iso-surfacing[slides] Final project introduction (make your choice earlier) [see the assignment tab] |
|
| Week 6 (09/28, 30) |
3D scalar field visualization - DVR - Raycasting [slides] (Assignment 3 out) [Check the Assignments tab] DVR - Splatting and texture-based [slides] Transfer functions - principles and practices [slides] |
|
| Week 7 (10/05, 07) |
2D vector field
visualization - direct method and geometric-based method [slides] 2D vector field visualization - texture-based methods [slides] (Assignment 4 out) [Check the Assignments tab] Final project proposal due (10/11) |
|
| Week 8 (10/12, 14) |
2D vector field
visualization - Feature-based (phyiscal features) [slides] 2D vector field visualization - Feature-based (topological features) [slides] |
|
| Week 9 (10/19, 21) |
3D vector field visualization - challenges and common techniques
[slides] Unsteady vector field visualization - theory and practice [slides] (Assignment 5 out) [Check the Assignments tab] |
|
| Week 10 (10/26, 28) |
IEEE Visualization 2021 Conference (Attendance for active students is
FREE !!) Self study and review on 10/26! Mid-term exam (in person) on 10/28 (open book, open notes, bring your laptop!) |
|
| Week 11 (11/02, 04) |
Mid-term exam solution explanation Tensor field visualization - overview [slides] |
|
| Week 12 (11/09, 11) |
Tensor field
visualization - glyphs [slides] Tensor field visualization - geometric based, texture based [slides] |
|
| Week 13 (11/16, 18) |
Graph visualization - Part I [slides] Graph visualization - Part II [slides] |
|
| Week 14 (11/23, 25) |
Higher-dimensional data visualization -- overview [slides] Thanksgiving Holiday! |
|
| Week 15 (11/30, 12/02) | Final project presentation |
| The
structure of the presentation (6 mins + 2
mins Q&A, a stopwatch will be used!!!): The final project
presentation will take place on Nov. 30 and Dec. 2 in the class. Your presentation should contain:
- Problem definition (especially what is the visualization problem you are addressing) - Describe your technique (mostly on algorithm and visualization/interface design) - Results and/or demo (Show your current results. Provide necessary interpretation of your visualization. How do you know you have resolved the problem?) - Future Work (If your results are half-cooked, what else do you still need to do to make it complete before the deadline? If the results are ready/finalized, what do think you can improve further in the future) |
|
You will need to submit your source code, your final project presentation (.pptx or .pdf), and your report (see below) in a single .zip file via the blackboard system by December 5! For the final report, please write it in the IEEE TVCG style (5-8 pages including figures and illustrations). You can find the template of this format in the following link (you can find the downloadable templates, words or Latex, on the webpage): https://www.computer.org/web/tvcg/author The final report should include the following components:
|
-
Sebastian Eichelbaum,
Mario Hlawitschka, and Gerik Scheuermann
,
LineAO—Improved
Three-Dimensional Line Rendering
-
Tobias Günther, Christian
Rössl, Holger Theisel
,
Opacity
optimization for 3D line fields
-
Frida Hernell, Patric
Ljung, and Anders Ynnerman
.
Local
Ambient Occlusion in Direct Volume Rendering
,
-
Daniel Jönsson, Erik
Sundén, Anders Ynnerman, and Timo Ropinski
.
A
Survey of Volumetric Illumination Techniques for Interactive Volume
Rendering
-
Guoning Chen, Konstantin
Mischaikow, Robert S. Laramee, Pawel Pilarczyk, and Eugene Zhang
.
Vector
Field Editing and Periodic Orbit Extraction Using Morse Decomposition
-
Matt Edmunds, Robert S.
Laramee, R. Malki, I.Masters, T.N. Croft, Guoning Chen, and Eugene Zhang
.
Automatic
Stream Surface Seeding: A Feature Centered Approach
-
Mathias Hummel, Christoph
Garth, Bernd Hamann, Hans Hagen, and Kenneth I. Joy.
Iris:
Illustrative rendering for integral surfaces
-
Tobias Günther, Maik
Schulze, Janick Martinez Esturo, Christian Rössl, Holger Theisel
.
Opacity
Optimization for Surface
- Jin Huang,
Zherong Pan, Guoning Chen, Wei Chen, and Hujun Bao.
Image-Space
Texture-Based Output-Coherent Surface Flow Visualization
- JJ van Wijk, Image based flow visualization for curved surfaces
-
Samer Barakat, Christoph
Garth, and Xavier Tricoche.
Interactive
computation and rendering of finite-time Lyapunov exponent fields
- Kai Buerger, Florian Ferstl, Holger Theisel, and Rüdiger Westermann. Interactive streak surface visualization on the GPU
-
Xiaoqiang Zheng and Alex
Pang
. HyperLIC,
-
Eugene Zhang, James Hays,
and Greg Turk
.
Interactive
Tensor Field Design and Visualization on Surfaces
-
Gordon Kindlmann and
Carl-Fredrik Westin.
Diffusion
tensor visualization with glyph packing
- Xifeng Gao,
Wenzel Jakob, Marco Tarini, Daniele Panozzo.
Robust
Hex-Dominant Mesh Generation using Field-Guided Polyhedral Agglomeration
.
-
Potter, Kristin, Andrew
Wilson, Peer-Timo Bremer, Dean Williams, Charles Doutriaux, Valerio
Pascucci,
and Chris R. Johnson.
Ensemble-vis:
A framework for the statistical visualization of ensemble data
-
Marc G Genton, Christopher
Johnson, Kristin Potter, Georgiy Stenchikov, Ying Sun
.
Surface
Boxplots
.
- Mahsa
Mirzargar, Ross T. Whitaker, and Robert M. Kirby.
Curve
boxplot:
Generalization of boxplot for ensembles of curves
.
-
Usher, Will, Pavol
Klacansky, Frederick Federer, Peer-Timo Bremer, Aaron Knoll, Jeff
Yarch,
Alessandra Angelucci, and Valerio Pascucci
.
A
virtual reality visualization tool for neuron tracing
-
Cordeil, Maxime, Andrew
Cunningham, Benjamin Bach, Christophe Hurter, Bruce H. Thomas, Kim
Marriott,
and Tim Dwyer
.
IATK:
An Immersive Analytics Toolkit
,