COSC 6344 Visualization
Fall 2022 (section 13304)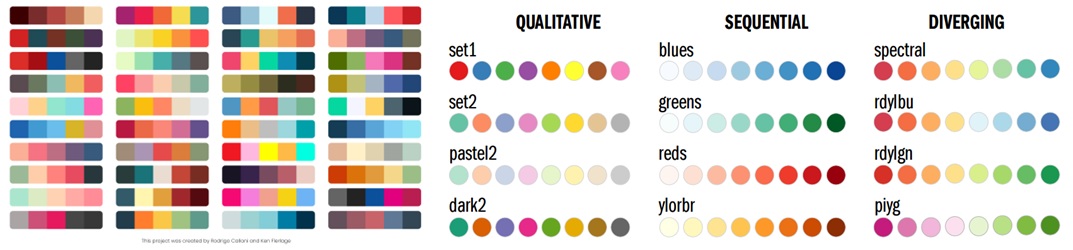
Basic info:
TIME: Tu/Th 1~2:30PM
LOCATION: Science Building S 119
INSTRUCTOR: Guoning Chen
OFFICE HOURS: Thursday 2:30pm-4pm taking place virtually via MS Teams (Please check your Teams Calendar for the link)
EMAIL: gchen22@central.uh.edu
OFFICE PHONE: 713-743-5788
TA: Nguyen K Phan (email: nkphan@uh.edu)
TA Office Hours: Tue/Thu 11AM-12PM via MS Teams (Please check your Teams Calendar for the link)
-
Presence in Class:
Syllabus (pdf)
Syllabus Changes:Due to the changing nature of the COVID-19 pandemic, please note that the instructor may need to make modifications to the course syllabus and may do so at any time. Notice of such changes will be announced as quickly as possible through class emails, lectures announcement, course webpage, and course team on MS Teams.
-
Course
summary and description:
Visualization
has been established as a powerful means to help domain experts from
various
disciplines or general audience to MAKE SENSE and PRESENT their data,
for
decision making. Techniques and knowledge from different sub-fields of
computer
science (including computer graphics, image processing, data structures
and
algorithms, high performance computing, machine learning, and
human-computer
interaction), mathematics, cognitive and perception science, and
specific
application domains are often adapted for various visualization
problems. This
introductory course covers topics from a number of sub-fields of
visualization
and aims to show students how data visualization can help find
solutions to a
wide range of practical data interpretation problems arising in many
areas.
Through this course, students are expected to
(1) get familiar with
important concepts, principles, and techniques/methods for the
visualization of
different types of data, and (2) foster the ability to select the
proper
visualization techniques when given a practical data visualization
problem
.
This course serves as one of the core introductory level graduate
courses, and
it helps build a complete course catalog in the direction of visual
computing
with courses like image processing, computer graphics, and computer
vision.
- Prerequisites:
You are expected to have basics knowledge on linear algebra, linear
systems, calculus, geometry, numerical analysis, and programming
languages. Homework assignments and course projects will require
knowledge and experience of C++ and/or Python. Visualization Toolkit
(VTK) will be used with either C++ or Python to complete the
programming assignments. You need to have solid grasp of data structure and algorithm design. Minimal
familiarity with computer graphics principles and techniques is assumed. Having
taken COSC 6372: Computer Graphics is ideal but not required.
-
Textbooks:
(recommended, but not required)
Visualization techniques are highly application dependent and highly
diversified! There is currently no a good texxtbook that can summarize
all
available techniques. However, the following textbooks provide a good
introduction to some well-established techniques for a number of
fundamental
visualization problems.
-
Data Visualization: Principles and Practice. Second
Edition. Alexandru C. Telea, A.K. Peters, 2014.
-
Introduction
to Information Visualization.
Riccardo Mazza, Springer, 2009.
-
Charles D. Hansen and Chris R. Johnson,
Visualization Handbook, Elsevier, 2004.
-
Storytelling with Data. Cole Nussbaumer Knaflic,
Wiley, 2015.
- Grading:
- Assignments – 30%
- Mid-term exam – 20%
- In-class quizzes – 15%
- Final project – 30%
-
In-class participation
(including discussion and presentation of papers and projects) - (5%)
A student needs
to score on average at least 60% in
total to
pass the class.
Grading scale (
tentative
): A:
>92%;
A-: >88%; B+: >84%; B: >80%; B-: >74%; C+: >68%; C: >
60%.
- Addendum: Whenever possible, and in accordance with 504/ADA guidelines, the University of Houston will attempt to provide reasonable academic accommodations to students who are registered and approved through the Center for Students with Disabilities. Students are responsible for communicating with the faculty to be sure appropriate arrangements are made. Registering with CSD is not sufficient. Communication is critical. Please call 713-743-5400 for more assistance.
- Academic Honesty: It is each student’s responsibility to read and understand the Academic Honesty Policy found at http://catalog.uh.edu/content.php?catoid=6&navoid=1025. There will be no tolerance towards academic dishonesty, and cheating can lead to report of a violation of the Academic Honesty policy to the UH Office of Undergraduate Academic Affairs. Specifically for this course, do your own work. The default consequence for academic dishonesty is a failure for the course. It is okay to discuss with other students’ general ideas about implementing a program. It is NOT okay to copy another student's program. It is okay to discuss possible program bugs. It is NOT okay to debug another student's program.
- Excused Absence Policy: Regular class attendance, participation, and engagement in coursework are important contributors to student success. Absences may be excused as provided in the University of Houston Graduate Excused Absence Policy for reasons including: medical illness of student or close relative, death of a close family member, legal or government proceeding that a student is obligated to attend, recognized professional and educational activities where the student is presenting, and University-sponsored activity or athletic competition. Under these policies, students with excused absences will be provided with an opportunity to make up any quiz, exam or other work that contributes to the course grade or a satisfactory alternative. Please read the full policy for details regarding reasons for excused absences, the approval process, and extended absences. Additional policies address absences related to military service, religious holy days, pregnancy and related conditions, and disability.
Lecture Slides
|
Timeline |
Lectures |
Additional
Reading Materials and Resources |
|
Week 1 (08/23, 25) |
Course introduction, visualization introduction [slides] Visualization pipeline [ slides], different data types and data storage [slides] |
|
| Week 2 (08/30, 09/01) |
Cognition and perception, what need to be considered
[slides]
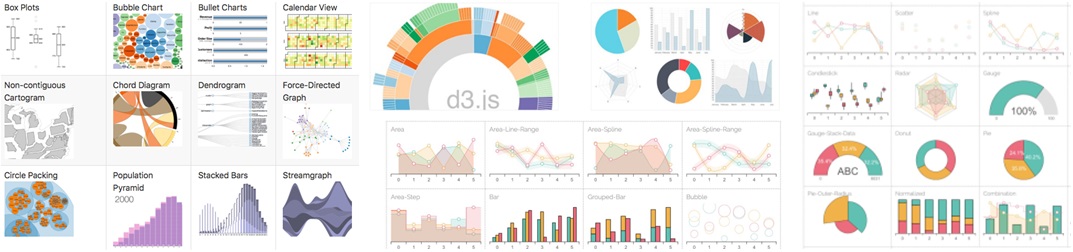
Elementary plots-principles and practices [slides] (Please watch the recordings for the introduction on some simple plots and a short tutorial for plotting using Python+matplotlib/seaborn on Teams) (Assignment 1 out (due on September 8)) [Check the Assignments tab] |
|
| Week 3 (09/06, 08) |
Colors in visualization
[slides] VTK introduction [slides] (A simple vtk demo program can be found here. You can run it in Spyder or via command line in the powershell of your conda. You can use the data sets for Assignment 2 for this demo.) |
VTK resources:
|
| Week 4 (09/13, 15) |
2D scalar field visualization - color plots [slides] 2D scalar field visualization - isocontouring [slides] ( Assignment 2 out (due on September 22) ) [Check the Assignments tab] |
|
| Week 5 (09/20, 22) |
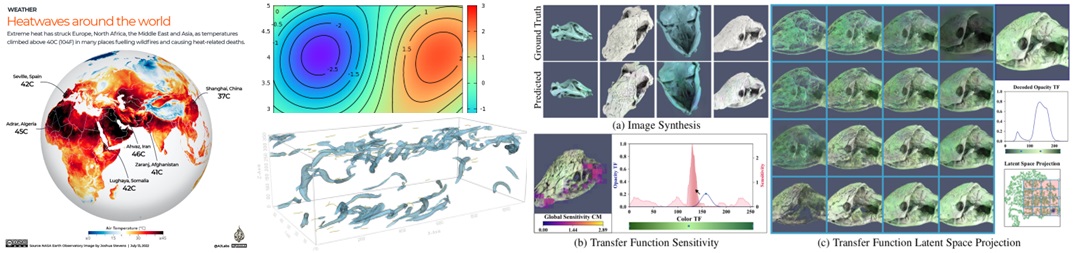
3D scalar field visualization - iso-surfacing
[slides]
3D scalar field visualization - DVR - Raycasting [slides] Final project (make your choice earlier) [see the assignment tab] |
|
| Week 6 (09/27, 29) |
3D scalar field visualization - DVR - Splatting and texture-based
[slides]
( Assignment 3 out (due on October 11) ) [Check the Assignments tab] Transfer function design - principles and practices [slides] |
|
| Week 7 (10/04, 06) |
2D vector field visualization - direct method and geometric-based method
[slides] 2D vector field visualization - texture-based methods [slides] Final project proposal due (10/09) |
|
| Week 8 (10/11, 13) |
2D vector field
visualization - Feature-based (phyiscal features)
[slides] ( Assignment 4 out (due on October 27) ) [Check the Assignments tab] 2D vector field visualization - Feature-based (topological features) [slides] |
|
| Week 9 (10/18, 20) |
IEEE Visualization 2022 Conference Self study and review on 10/18! Mid-term exam (in person) on 10/20 (open book, open notes, bring your laptop!) |
|
| Week 10 (10/25, 27) |
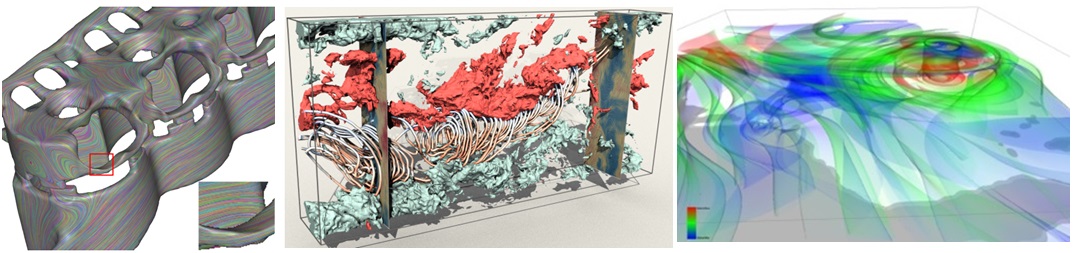
3D vector field visualization - challenges and common techniques
[slides] Unsteady vector field visualization - theory and practice [slides] ( Assignment 5 out ) [Check the Assignments tab] |
|
| Week 11 (11/01, 03) |
Mid-term exam solution explanation Tensor field visualization - overview [slides] |
|
| Week 12 (11/08, 10) |
Tensor field visualization - glyphs
[slides] Tensor field visualization - geometric based, texture based [slides] |
|
| Week 13 (11/15, 17) |
Graph visualization - Part I
[slides] Graph visualization - Part II [slides] |
|
| Week 14 (11/22, 24) |
Higher-dimensional data visualization -- overview
[slides] 11/24 Thanksgiving Holiday! No Class! |
|
| Week 15 (11/29, 12/01) |
Final project
presentation
|
|
Assignments
An installation guide for Anaconda, Python, VTK, and PyQtVTK demo program (use the data set of Assignment 2 below)
-
Assignment 1: Effective plots and graphs [description] [data] (Due on 09/08/2022)
-
Assignment 2: 2D scalar field visualization - color plots, isocontouring [description] [data] [ skeleton code for assignment 2] (Due on 09/22/2022)
The following is a simple vtk python code with QT GUI and a tutorial explaining how the QT interface is designed and modified
[ code , a short tutorial ]
-
Assignment 3: 3D scalar field visualization - cut planes, iso-surfacing, DVR [description] [data] [ skeleton code for assignment 3] (Due on 10/11/2022) -
Assignment 4: 2D vector field visualization - arrow plot, streamlines, texture-based [description] [data] [ skeleton code for assignment 4] (Due on 10/30/2022) -
Assignment 5: 3D vector field visualization - arrow plot, streamlines, stream-surfaces [description] [data] [arrows3d_Ex.py shows how to create 3D arrows] (Due on 11/15/2022)
Final Projects
If you already have a research topic with a faculty
of the department and there is a clearly defined visualization problem
in your research, please talk to me to see whether it will make a
qualified final project for the course. Otherwise, please choose from
the following options. TBD [
last year one course project led to a
paper accepted by CIKM2022 -- the number 7 conference in databases and
information systems!!!
]Final Project Proposal (Due on October 9 (5%))
Please submit a final project proposal to the Blackboard. Your proposal should include the following information- Title -- what problem (or option) you are going to work on
- Team members -- who will be on your team and their respective roles (who do what?)
- A tentative strategy to address the problem -- this can be some techniques you learned from the class or reported in some papers. Please do provide a list of references
- A tentative timeline -- what are the individual milestones of your project
Final Project Presentation on ( November 29 and December 1 (30%) Peer-grading)
Your presention should include the following components- Problem definition (especially what is the visualization problem you are addressing)
- Describe your technique (mostly on algorithm and visualization/interface design) Briefly describe who (which member) did what
- Results and/or demo (Show your current results. Provide necessary interpretation of your visualization. How do you know you have resolved the problem?)
- Future Work (If your results are half-cooked, what else do you still need to do to make it complete before the deadline? If the results are ready/finalized, what do think you can improve further in the future)
Final Report ( Due on December 8 (65%))
Your final report should be written in the IEEE TVCG style (at least 4 pages double-column including figures and illustrations). You can find the template (in words or Latex) of this format in the following link.https://www.computer.org/web/tvcg/author
Your report should include the following components. A report not including ALL the following components and/or not following the suggested IEEE double-column format will result in the loss of points .
- Title, List of Authors, and Abstract
- Introduction
- Related Works
- Methodology and Implementation (include necessary flow charts and pseudo-code, more importantly, details of each member's contributions!!!)
- Results and Discussion (make sure you interpret your visualization and results, provide meaningful discussion)
- Conclusion and future work (make sure you describe the limitations of the current implementation)
The following is a tentative list of possible final project topics and is subject to change. Please check back regularly to see the updated list.
- Visualization of a flow diagram built from programs preprocessing big data
See the following abstract for a reference. Please also contact Dr. Carlos Ordonez (carlos@central.uh.edu) for more details about this problem.
- Carlos Ordonez, Sikder Tahsin Al-Amin, Ladjel Bellatreche. An ER-Flow Diagram for Big Data, IEEE Big Data Conference (BigData, posters) 2020: [PDF] [PPT]
- Effective visualization of big OLAP Cubes
- Carlos Ordonez, Zhibo Chen, Alfredo Cuzzocrea, Javier Garcia-Garcia. An Intelligent Visual Big Data Analytics Framework for Supporting Interactive Exploration and Visualization of Big OLAP Cubes, IEEE IV Conference (Information Visualization) 2020: [PDF]
- Effective visualization of contours under different settings
- Visual analysis of a traffic light data (suitable for single-person or two-person teams)
- Glenn Turner, Guoning Chen, Yunpeng Zhang, " A Visual Analytics Approach for Anomaly Detection from a Novel Traffic Light Data ," IS&T Electronic Imaging, Visualization and Data Analysis (VDA) 2021, virtual event, January, 2021. [Data can be found in this link]
-
Tentative: visualize bias in NLP training data sets
This is a project proposed by Dr. Thamar Solorio of the CS department. The purpose is to reveal hidden bias in the training (or other) data sets. There could be different criteria for the definition of bias. In this case, we are interested in the words, phrases (or other features) that may (or may not) be negatively associated with certain groups of people or certain countries.
-
Tentative: visualize task scheduling in HPC
This is a project proposed by Dr. Panruo Wu of the CS department. The purpose is to intuitively visualize the communication between different parallel tasks (run on different cores or nodes) for a computing job OVER TIME. This is similar to the problem of visualizing a dynamic graph.
-
Tentative: FCLWebVis an online web-browser scientific data visualization platform
This is a project proposed by Dr. Guoning Chen. The purpose is to set up an online Scientific Data visualization platform to facilitate the deployment of newly developed visualization techniques. The prototype of the system is almost ready for release. The task here is to improve the user interface, local web-browser based visualization, and adding new tasks/services to the platform. [a reference paper]
-
Tentative: Visualize cybersecurity related data
This is a project proposed by Dr. Yunpeng Zhang from the Department of Information and Logistics Technology.
The following are two candidate data sets for this project.
- KDD Cup 1999 Data. This database contains a standard set of data to be audited, which includes a wide variety of intrusions simulated in a military network environment.
- UNSW-NB15 Computer Security Dataset was created by the IXIA PerfectStorm tool in the Cyber Range Lab of UNSW Canberra for generating a hybrid of real modern normal activities and synthetic contemporary attack behaviours.
A visualization technique has been developed to show this data which you may refer to for your final project. You can find a description of this technique in this paper.
-
Tentative: Visualize small-scale microvascular networks
This is a project proposed by Dr. David Mayerich from the Department of Electrical and Computer Engineering. The data will be a microvascular network extracted from a small block of mouse brain (or other organ and tissue). The task is to visualize the network effectively using both graph and traditional line rendering so that the unique characteristics can be revealed through the patterns in the graph layout or the emphasis in rendering. [a reference paper]
-
Tentative: Uncertainty visualization of 2D vector fields using image-space Morse decomposition
This is a project proposed by Dr. Guoning Chen. The purpose is to test the capability of Morse decomposition in the quantification and representation of uncertainty in 2D vector fields.
A source code for computing the image-space Morse decomposition can be found below, which can be used as a starting point for the project.
[Github] [paper]
-
Visualization Contests
If you are not interested in any of the above topics, you may also choose from one of the past (and current) visualization contests below, which offers a wide variety of data visualization problems.
All SciVis Contests
Visual Analytic Science and Technology (VAST) challenges
-
Virtual reality (or augmented reality) for visualization
- Usher, Will, Pavol Klacansky, Frederick Federer, Peer-Timo Bremer, Aaron Knoll, Jeff Yarch, Alessandra Angelucci, and Valerio Pascucci. A virtual reality visualization tool for neuron tracing
- Cordeil, Maxime, Andrew Cunningham, Benjamin Bach, Christophe Hurter, Bruce H. Thomas, Kim Marriott, and Tim Dwyer. IATK: An Immersive Analytics Toolkit
-
Effective visualization of 3D cross/frame fields
- Xifeng Gao, Wenzel Jakob, Marco Tarini, Daniele Panozzo. Robust Hex-Dominant Mesh Generation using Field-Guided Polyhedral Agglomeration .
-
Ensemble data visualization
- Potter, Kristin, Andrew Wilson, Peer-Timo Bremer, Dean Williams, Charles Doutriaux, Valerio Pascucci, and Chris R. Johnson. Ensemble-vis: A framework for the statistical visualization of ensemble data .
- Marc G Genton, Christopher Johnson, Kristin Potter, Georgiy Stenchikov, Ying Sun. Surface Boxplots .
- Mahsa Mirzargar, Ross T. Whitaker, and Robert M. Kirby. Curve boxplot: Generalization of boxplot for ensembles of curves .