Instructor: Guoning Chen
Location: SEC 201
Time: Tue/Th. 10am~11:30am
Office Hours: Tue/Th. 11:30am~12:30pm or by appointment.
TA: Cheng Xiao, Email: chengxiao1985@gmail.com, Office Hours: Mon./Wed. 1pm~2:00pm at PGH 313/309
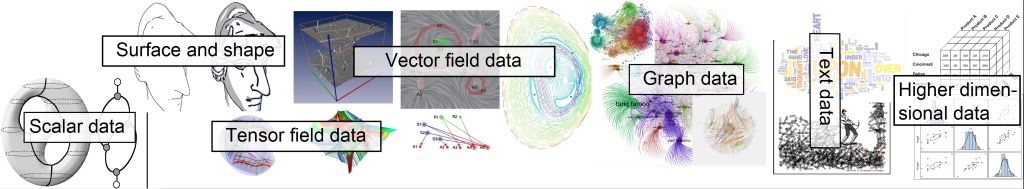
Nowadays, data are continuously generated to describe various natural and social events and phenomena in our world. Processing and interpreting these data provides valuable insights to these events and phenomena for later decision making. However, with the continuous growth of computational power and storage space, the diversity and the sizes of data from different application domains increase exponentially. Relying human brain to extract useful information directly from the raw data is nearly impossible. Algorithms, techniques and user interface have been developed to help data owners more efficiently identify “features, patterns or trends” from their data for effective representation and interpretation of the phenomena that these data are describing. This course will expose the students to a number of standard algorithms and techniques for the analysis of different types of data including both scientific and information data. Through this course, the students are expected to be able to devise their analysis framework given different types of data.
Prerequisites:
No specific courses are required to be taken before this course, although some background in mathematics and physics as well as elementary knowledge on programming will help. Knowledge on computer graphics can be helpful but not required.
Textbook: (recommended, but not required)
Reading Materials:
Grading: 3 assignments (50%) + 1 final project and presentation (40%) + course participation (10%) ( C/C++ will be the primary language with OpenGL library. Other languages are possible. Please talk to me about the alternative.)
Late Policy: Late assignments will be marked off 20% for each weekday that it is late.
Academic Dishonesty: You can discuss course materials, algorithms, and programming skills. But, please do you own work! DO NOT copy code from others or internet!
Week 1: Introduction, data types and PLY format , OpenGL basic review
Week 2: Shape analysis, compute bounding box, Euler Characteristic, curvature estimation ( Assignment 1 out )
Week 3: Shape analysis, feature lines (intrinsic or view-dependent), medial axis computation, GSM
Week 4: Shape analysis, Reeb graph
Week 5: Morse-Smale complex and applications, Flow data introduction
Week 6: vector field basic, compute differential topology ( Assignment2 out)
Week 7: combinatorial topology
Week 8: time-dependent data analysis, final project topic review .
Week 9: Spring break! No class.
Week 10: Vector field non-topological features , Tensor data analysis, introduction
(deadline for final project proposal)
Week 11: introduction (continued) Tensor field topology, Asymmetric tensor analysis
Week 12: Graph data analysis (review)
Week 13: Graph data analysis (review), continued , Text analysis and higher dimensional data analysis (review)
Week 14~16: Student presentation
1. Introduction and PLY data format
This section will introduce the background of the course to the student as well as the requirement and goal of learning. I will also review the data format that is used to represent the majority of the data that are discussed and processed through the class.
An online handbook: OpenGL programming handbook
3. Shape analysis (bounding box and Euler Characteristic)
This section will review the fundamental characteristics that shape analysis is focused on. In particular, we will learn how to compute the bounding box of a given 3D model which can be used for application such as collision detection. Second, we will learn a topological invariant of shape, called the Euler Characteristic, and how this invariant can be used to describe surface configuration.
Additional reading material on principal component analysis
Lindsay I Smith, A tutorial on Principal Component Analysis
Herve Abdi and Lynne J. Williams, Principal Component Analysis
4. Surface curvature and the discrete estimation
This section will introduce the mathematical definitions of various curvature on surface. Specifically, mean curvature, Gaussian curvature, and the principle curvatures will be introduced. The discrete algorithms to compute these different curvature measurement will be discussed.
Additional reading on curvature estimation
M. Meyer, M. Desbrun, P. Schroder, and A. H. Barr. Discrete Differential-Geometry Operators for Triangulated 2-Manifolds (Refer to the later papers that cite this one as well)
E. Kalogerakis, P. Simari, D. Nowrouzezahrai, and K. Singh. Robust statistical estimation of curvature on discretized surfaces.
A. Razdan and M. Bae. Curvature Estimation Scheme for Triangle Meshes Using Biquadratic Bezier Patches.
S. Hermann and R. Klette A Comparative Study on 2D Curvature Estimations
5. Line drawing for conveying surface characteristics
Finding the important feature lines on surface is important to many application involving shape understanding and visualization. The definitions of these feature lines depend on not only the intrinsic characteristics of the surface, such as curvature, but also are affected by the choice of view point. We will introduce the contours and suggestive contours as an example of finding the feature lines.
Additional reading on line drawing on shape conveying:
D. DeCarlo, A. Finkelstein, S. Rusinkiewicz, and A. Santella. Suggestive Contours for Conveying Shape. (Also look for the later papers that cite this one)
T. Judd, F. Durand, and E. Adelson. Apparent ridges for line drawing.
FY. Lee, L. Markosian, S. Lee, and J. Hughes. Line drawings via abstracted shading.
M. Kolomenkin, I. Shimshoni, and A. Tal. Demarcating curves for shape illustration.
F. Cole, A. Golovinskiy, and A. Limpaecher. Where do people draw lines?
6. Medial axis and generalized swept mid-structure of polygonal mesh
Finding the skeletal structure of a 3D object is important for the applications including skeleton-based animation, shape analysis and matching, and meshing. The standard approach to define the skeleton of a 3D object is either computing its medial axis and 1D skeleton. We will briefly review these mid-structure of the object and introduce the generalized swep mid-structure.
Additional reading on medial axis and GSM:
B. Miklos, J. Giesen, and M. Pauly. Discrete Scale Axis representation for 3D geometry.
O.K. Au, C.Tai, H. Chu, D. Cohen-Or, T. Lee. Skeleton extraction by mesh contraction.
T. Martin, G. Chen, S. Musuvathy, and C. Hansen. Generalized Swept Mid-Structure for Polygonal Models.
7 and 8. Topology extraction from scalar data: Reeb graph and Morse-Smale complex
Topology provides a mathematically rigorous means to partition the spatial domain based on the characteristics of the scalar field that is defined on it. It consists of critical points and their connectivity. It is one of the few invariant characteristics of the scalar data. In this section, we will learn two standard definitions and computations of scalar field topology, including Reeb graph and the Morse-Smale complex.
Lec7_slides (Surface Topology and Reeb graph)
Lec8_slides (Morse-Smale Complex)
Additional materials:
This is a rather advanced topic. The additional readings are provided at the end of the lecture.
9. Flow data and vector field differential topology
Vector fields are a common form of data that are generated from various sources. They are widely used to study the behaviors of gas and liquids under certain circumstances, which is dominated by certain aero- and hydro- dynamical systems. Computing vector field topology provides a rigorous way to analyze vector-valued data. There are different representations of vector field topology in the current literature. We will review some of the most important ones in this lection and the following ones. We start with the introduction of the differential topology of vector fields.
Lec9_slides (vector field introduction)
Lec9_2slides (differential topology)
Additional reading:
- Frits H. Post, Benjamin Vrolijk, Helwig Hauser, Robert S. Laramee and Helmut Doleisch. The State of the Art in Flow Visualization: Feature Extraction and Tracking. Computer Graphics Forum, 22 (4): pp. 1-17, 2003.
- Robert S. Laramee, Guoning Chen, Monika Jankun-Kelly, Eugene Zhang, and David S. Thompson, Bringing Topology-Based Flow Visualization to the Application Domain, in Topology-Based Methods in Visualization II (Proceedings of Topo-In-Vis 2007, 4–6 March 2007, Kloster Nimbschen near Leipzig, Germany), Mathematics and Visualization, H.-C. Hege, K. Polthier, G. Scheuermann editors, pages 161-176, 2009, Springer-Verlag.
- Robert S. Laramee, Helwig Hauser, Lingxiao Zhao, and Frits H. Post, Topology-Based Flow Visualization, The State of the Art, in Topology-Based Methods in Visualization (Proceedings of Topo-In-Vis 2005, 29–30 September 2005, Budmerice, Slovakia), Mathematics and Visualization, H. Hauser, H. Hagen, and H. Theisel editors, pages 1-19, 2007, Springer-Verlag
10. Combinatorial topology-Morse decomposition
Combinatorial topology is a recently popular representation of vector field topology which can partially address the numerical instability issue of the differential topology which relies heavily on the numerical integration. In this section, we will specifically focus on the computation of Morse decomposition of vector field in 2D setting.
Additional reading:
Guoning Chen, Konstantin Mischaikow, Robert S. Laramee, and Eugene Zhang. "Efficient Morse Decompositions of Vector Fields". IEEE Transactions on Visualization and Computer Graphics, Vol. 14, No. 4, 2008, pp. 848-862 [Technical Report].
Guoning Chen, Qingqing Deng, Andrzej Szymczak, Robert S. Laramee, and Eugene Zhang. "Morse Set Classification and Hierarchical Refinement using Conley Index", IEEE Transactions on Visualization and Computer Graphics, Vol 18 (5): pp. 767-782, 2012 [pdf].
11. Time-dependent vector field analysis-Topology-based method (advanced topic)
Time-dependent vector field data is prominant in the applications involving vector-valued data analysis. Due to the additional time dimension, the previous definition for the static (or time-independent) vector fields is no longer valid. New theories, representations, and algorithms need to be developed to address this challenge. This is an advanced topic and we will review some of the recent advance in this area.
Additional reading:
Frits H. Post, Benjamin Vrolijk, Helwig Hauser, Robert S. Laramee, and Helmut Doleisch, The State of the Art in Flow Visualisation: Feature Extraction and Tracking, in Computer Graphics Forum (CGF), Vol. 22, No. 4, 2003, pages 775-792.
Helwig Hauser, Robert S. Laramee, and Helmut Doleisch, Topology-Based Versus Feature-Based Flow Analysis - Challenges and an Application, in Topo-In-Vis 2005, pages 79-90, 2007, Springer-Verlag.
Armin Pobitzer, Ronald Peikert, Raphael Fuchs, Benjamin Schindler, Alexander Kuhn, Holger Theisel, Kresimir Matkovic, Helwig Hauser. On the Way Towards Topology-Based Visualization of Unsteady Flow - the State of the Art , in EuroGraphics 2010.
12. Vector field non-topological analysis - vortex detection.
Can vector field topology describe every aspect of the vector-valued data? The answer is no. Many physically driven or application-dependent features or patterns cannot be included in the vector field topology. Vortices, separation structure, and coherent structures are some examples. Developing efficient algorithms to detect these non-topological features can provide complementary information to the vector field topology. This section will introduce techniques on the detection of these general features.
Additional reading:
Alexander Wiebel. Feature dectection in vector fields using the Helmholtz-Hodge decomposition. Diploma-Thesis.
DC Banks, Vortex tubes in turbulent flows: identification, representation, reconstruction, IEEE Visualization 1994.
Ming Jiang, Raghu Machiraju, and David Thompson. Detection and visualization of vortices. The visualization handbook, 2005.
J. Sahner, T. Weinkauf, and H.-C. Hege. Galilean Invariant Extraction and Iconic Representation of Vortex Core Lines. EuroVis05.
Tobias Schafhitzel, Joachim E. Vollrath, Joao Paulo Gois, Daniel Weiskopf, Antonio Castelo, and Thomas Ertl. Topology-Preserving lambda_2-based Vortex Core Line Detection for Flow Visualization. Vol 27(3): 1023-1030, Computer Graphics Forum, 2008.
T. Weinkauf, J. Sahner, H. Theisel, H.-C. Hege. Cores of swirling particle motion in unsteady flows. IEEE Visualization 2007.
13. Tensor field introduction and topology-based analysis
Tensor field is a complex subject in scientific data analysis. Generally speaking, scalar data and vector-valued data can be considered as the special cases of tensor data, i.e. zero-order tensor and first-order tensor, respectively. Tensor is also a powerful mathematical tool which can be used to describe complex physical properties of objects and space. This section will review some of the fundamental of tensor calculus with the focus on the tensor field topology definition and computation.
Additional reading:
Andrea Kratz, Cornelia Auer, Markus Stommel, Ingrid Hotz. Visualization and Analysis of Second-Order Tensors: Moving Beyond the Symmetric Positive-Definite Case. Computer Graphics Forum - State of the Art Reports, 2012.
14. Asymmetric tensor field analysis
Asymmetric tensor field has been recently introduced in the analysis of flow data. It provides the flow kinematic (or deformation) information that the direct vector representation cannot.
Lec14_slides
Additional reading:
Eugene Zhang, Harry Yeh, Zhongzang Lin, and Robert S. Laramee, "Asymmetric Tensor Analysis for Flow Visualization", IEEE Transactions on Visualization and Computer Graphics, Vol. 15(1), 2009, pp. 106-122.
Xiaoqiang Zheng, Alex Pang. 2D asymmetric tensor field analysis, IEEE Visualization 2005.
Graphs have broad application in representing and analyzing various data. This lecture provides a brief review of some basic concepts from graph theory. One important task in graph data analysis, graph clustering is discussed. More general graph pattern identification via graph mining is also reviewed.
Additional reading:
Satu Elisa Schaeffer, Graph clustering, Computer Science Review I (2007), pp. 27-64.
16. Text analysis and Higher dimensional data analysis
This lecture will briefly review the challenges and issues of the text analysis. More details of text processing and mining can be learned from other classes such as machine learning. Higher dimensional data analysis is getting more and more attention these days. Due to our limited knowledge in the space beyond our physical world and the constraints of 2D display devices, analyzing and visualizing these types of data is specifically challenging. We will review some of issues and research problems of this topic.
Additional reading:
Assignment 1: Shape analysis (skeleton code for assignment 1)
Assignment 2: Vector field topology (skeleton code for assignment 2)
Assignment 3: Option 1) Tensor field analysis; Option 2) Graph analysis; Option 3) Histogram
Ideally, I expect your final project is related to your research problem and address the data analysis and processing issue in your research. The following are some tentative topics if you cannot find one from your research.
1. Curvature tensor estimation and shape illustrative rendering.
See the additional reading of Lecture 4.
2. Medial axis computation from 3D shapes.
Balint Miklos, Joachim Giesen, and Mark Pauly. Discrete Scale Axis Representations for 3D Geometry ACM Transactions of Graphics, SIGGRAPH 2010.
Mark Foskey , Ming C. Lin , Dinesh Manocha, Efficient computation of a simplified medial axis, Proceedings of the eighth ACM symposium on Solid modeling and applications, June 16-20, 2003.
2D Medial Axis Joachim Giesen , Balint Miklos , Mark Pauly , Camille Wormser, The scale axis transform, Proceedings of the 25th annual symposium on Computational geometry, June 08-10, 2009.
Kaleem Siddiqi , Sylvain Bouix , Allen Tannenbaum , Steven W. Zucker, Hamilton-Jacobi Skeletons, International Journal of Computer Vision, v.48 n.3, p.215-231, July-August 2002
3. 1D skeleton extraction from 3D shapes.
Oscar Kin-Chung Au, Chiew-Lan Tai, Hung-Kuo Chu, Daniel Cohen-Or, and Tong-Yee Lee. Skeleton Extraction by Mesh Contraction, ACM TOG (SIGGRAPH2008).
Andrea Tagliasacchi, Hao Zhang, and Daniel Cohen-Or, Curve-skeleton Extraction from Incomplete Point Cloud, ACM TOG (SIGGRAPH2009).
4. Ridges and valleys detection from scalar fields (e.g. images).
Yutaka Ohtake, Alexander Belyaev, and Has-Peter Seidel. Ridge-Valley Lines on Meshes via Implicit Surface Fitting. ACM TOG (SIGGRAPH2004).
Shin Yoshizawa, Alexander Belyaev, and Has-Peter Seidel. Fast and Robust Detection of Crest Lines on Meshes. SPM'05.
5. Compute Reeb graphs of 3D shapes.
Harish Doraiswamy and Vijay Natarajan. Output-sensitive construction of Reeb graphs, IEEE Transactions on Visualization and Computer Graphics, 18(1), 2012, 146-159.
V. Pascucci, G. Scorzelli, P.-T. Bremer, and A. Mascarenhas, Robust On-line Computation of Reeb Graphs: Simplicity and Speed. ACM Transactions on graphics, pp. 58.1-58.9, 2007, Proceedings of SIGGRAPH 2007.
6. Compute Morse-Smale for scalar field analysis.
Attila Gyulassy, Peer-Timo Bremer, Valerio Pascucci, Bernd Hamann. A Practical Approach to Morse Smale Complex Computation: Scalability and Generality. IEEE Trans. Vis. Comput. Graph. (IEEE Visualization 2008), 14(6): 1619-1626, 2008.
Reininghaus, J.; Hotz, I. Computational Discrete Morse Theory for Divergence-Free 2D Vector Fields. Topological Methods in Data Analysis and Visualization. Theory, Algorithms, and Applications. (TopoInVis'11), 3-14, 2012.
7. Compute differential topology of higher dimensional vector fields.
H. Theisel, T. Weinkauf, H.-C. Hege, H.-P. Seidel. Saddle connectors-an approach to visualizing the topological skeleton of complex 3D vector fields. IEEE Visualization 2003, pp. 225-232.
8. Compute MCG for higher dimensional flow analysis.
The additional reading in Lecture 10
Wieland Reich, Dominic Schneider, Christian Heine, Alexander Wiebel, Guoning Chen, Gerik Scheuermann. Combinatorial Vector Field Topology in 3 DimensionsTopoInVis2011, April 4-6, 2011, Zurich, Switzerland.
9. Compute combinatorial topology.
Reininghaus, J., Lowen, C., Hotz, I., Fast Combinatorial Vector Field Topology.IEEE Transactions on Computer Graphics and Visualization, 2011, 17, 1433-1443.
Reininghaus, J., Hotz, I. Combinatorial 2D Vector Field Topology Extraction and Simplification.Topological Methods in Data Analysis and Visualization. Theory, Algorithms, and Applications (TopoInVis'09), 2010.
10. Edge-map.
Harsh Bhatia, Shreeraj Jadhav, Peer-Timo Bremer, Guoning Chen, Joshua A. Levine, Luis Gustavo Nonato, and Valerio Pascucci. Flow Visualization with Quantified Spatial and Temporal Errors using Edge Maps, IEEE Transactions on Visualization and Computer Graphics, Vo. 18 (9): pp. 1383-1396, 2012.
Harsh Bhatia, Shreeraj Jadhav, Peer-Timo Bremer, Guoning Chen, Joshua A. Levine, Luis Gustavo Nonato, and Valerio Pascucci. Edge Maps: Representing Flow with Bounded Error. In Proceedings of IEEE Pacific Visualization Symposium, pp. 75-82, Hong Kong, China, Mar. 2011.
11. Time-dependent vector field topology
F. Sadlo and D. Weiskopf. Time-Dependent 2-D Vector Field Topology: An Approach Inspired by Lagrangian Coherent Structures. Computer Graphics Forum, Vol. 29, No. 1, 88-100, 2010.
Markus Uffinger, Filip Sadlo, Member, IEEE, and Thomas Ertl. A Time-Dependent Vector Field Topology Based on Streak Surfaces. IEEE TVCG (accepted, prePrint).
Feature tracking in time-dependent vector field analysis.
X. Tricoche, T. Wischgoll, G. Scheuermann, and H. Hagen. Topology Tracking for the Visualization of Time-Dependent Two-Dimensional Flows. Computer & Graphics 26, 2002, pp. 249-257.
T. Weinkauf, H. Theisel, A. Van Gelder, and A. Pang. Stable Feature Flow Fields. IEEE Transactions on Visualization and Computer Graphics 17(6), June 2011 .
12. Non-topological analysis of flow - Vortex detection
Kasten, J.; Reininghaus, J.; Hotz, I.; Hege, H.-C. Two-dimensional Time-dependent Vortex Regions based on the Acceleration Magnitude. Transactions on Visualization and Computer Graphics, 17(12), 2080-2087. 2011.
T. Schafhitzel, J. E. Vollrath, J. P. Gois, D. Weiskopf, A. Castelo, T. Ertl. Topology-Preserving lambda_2-based Vortex Core Line Detection for Flow Visualization. CGF 27(3): 1023-1030, 2008.
J. Sahner, T. Weinkauf, N. Teuber, H.-C. Hege. Vortex and Strain Skeletons in Eulerian and Lagrangian Frames.IEEE Transactions on Visualization and Computer Graphics 13(5), September - October 2007.
T. Weinkauf, J. Sahner, H. Theisel, H.-C. Hege. Cores of Swirling Particle Motion in Unsteady Flows. IEEE Transactions on Visualization and Computer Graphics (Proceedings Visualization 2007) 13(6), November - December 2007.
13. Extract invariant structure for tensor field analysis.
Auer, C. and Hotz, I. Complete Tensor Field Topology on 2D Triangulated Manifold embedded in 3D. EuroVis2011.
Xiaoqiang Zheng, Beresford Parlett, and Alex Pang, Topological Structures of 3D Tensor Fields, IEEE Visualization 2004.
Xavier Tricoche, Gordon Kindlmann, and Carl-Fredrik Westin, Invariant Crease Lines for Topological and Structural Analysis of Tensor Fields. IEEE Visualization 2008
14. Asymmetric tensor field analysis for flow analysis.
Eugene Zhang, Harry Yeh, Zhongzang Lin, and Robert S. Laramee, "Asymmetric Tensor Analysis for Flow Visualization", IEEE Transactions on Visualization and Computer Graphics, Vol. 15(1), 2009, pp. 106-122.
Xiaoqiang Zheng, Alex Pang. 2D asymmetric tensor field analysis, IEEE Visualization 2005.
15. Project on graph analysis.
Michael Burch, Corinna Vehlow, Fabian Beck, Stephan Diehl, and Daniel Weiskopf. Parallel Edge Splatting for Scalable Dynamic Graph Visualization. IEEE Information Visualization 2011.
Danny Holten and Jarke J. van Wijk. Force-Directed Edge Bundling for Graph Visualization. EuroVis2009
Gautam Kumar and Michael Garland. Visual Exploration of Complex Time-Varying Graphs, IEEE Information Visualization 2006.
16. Project on text analysis.
17. Project on higher dimensional data analysis.
Enrico Bertini, Andrada Tatu, and Daniel Keim, Quality Metrics in High-Dimensional Data Visualization: An Overview and Systematization. IEEE Information visualization 2011.
S. Gerber, P.-T. Bremer, v. Pascucci, and R. Whitaker, Visual Exploration of High Dimensional Scalar Functions. IEEE Transactions on Visualization and Computer Graphics 16(6), pp. 1271-1280, 2010 (this is actually a scientific visualization paper).