COSC 6344 Visualization
Fall 2023 (section 13073)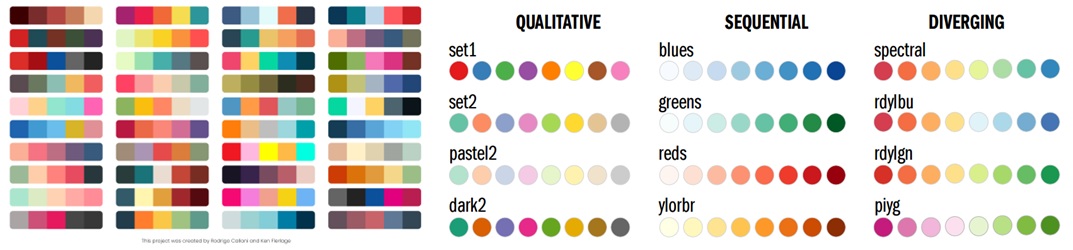
Colors in visualization
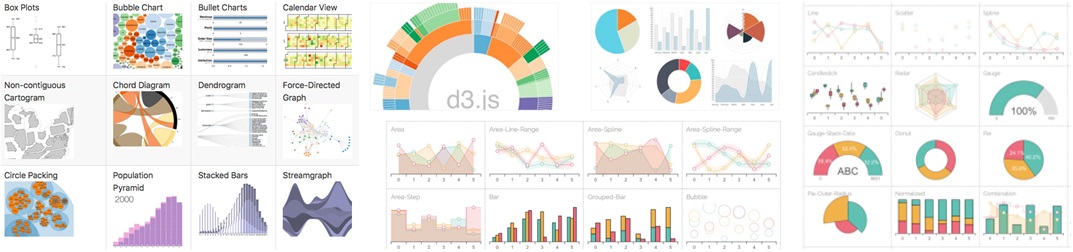
Elementary plots
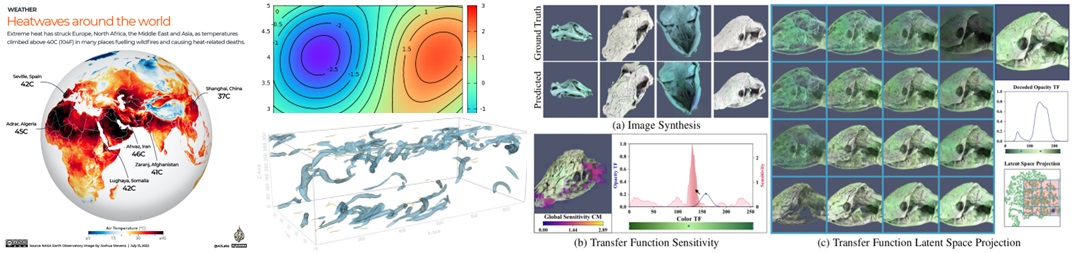
Scalar field visualization
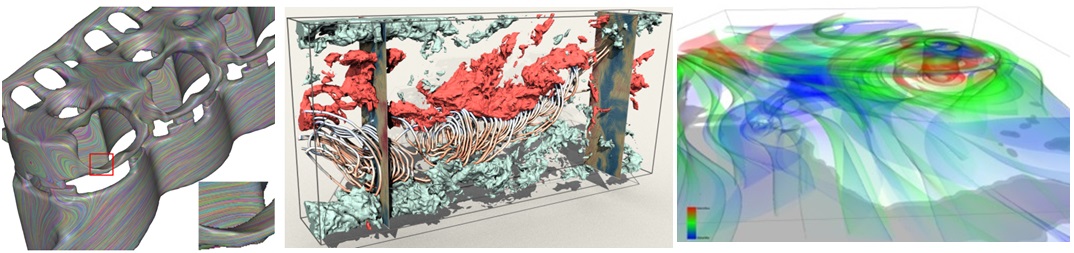
Vector field visualization
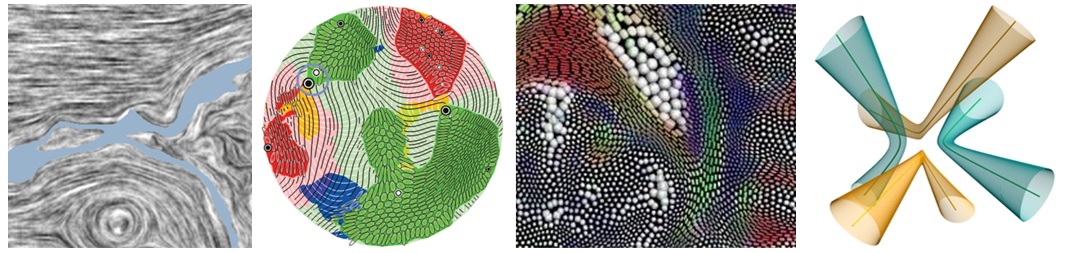
Tensor field visualization
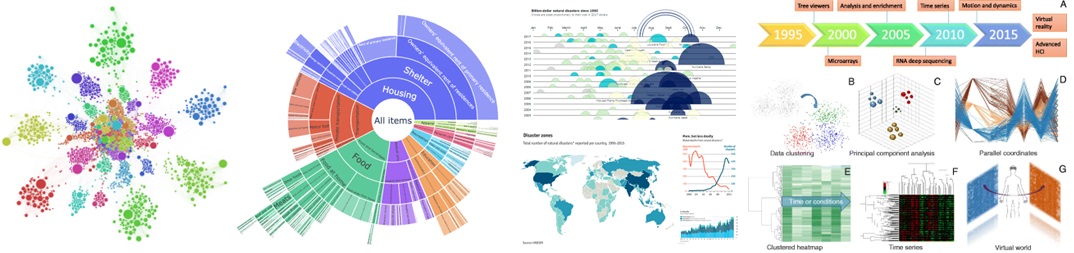
Information data visualization
Basic info:
TIME: Tu/Th 1~2:30PM
LOCATION: CBB 118
INSTRUCTOR: Guoning Chen
OFFICE HOURS: Thursday 2:30pm-4pm PGH 566
EMAIL: gchen22@central.uh.edu
OFFICE PHONE: 713-743-5788
TA: Nguyen K Phan (email: nkphan@uh.edu)
TA Office Hours: Monday 6-8PM on Teams. meeting link
-
Important Information:
All the lectures, exams, and quizzes take place in person unless announced otherwise.
No live streaming of lectures and no recordings of the lectures will be provided.
No make-up quizzes will be administered no matter the reasons. Please refer to the syllabus for the detailed grading of quizzes.
Although slides of the lecture of the courses will be shared with students, they DO NOT contain all details and information. Please make sure to come to the class to learn those details that will be important for exams and quizzes.
Please follow the Graduate Excused Absence Policy of the University to report your absence if you cannot make it to the classes.
Syllabus (pdf)
Syllabus Changes:This syllabus may be subjective to change due to natural disaster or other unexpected conditions. Notice of such changes will be announced as quickly as possible through class emails, lectures announcement, course webpage, and course team on MS Teams.
-
Course summary and description:
Visualization has been established as a powerful means to help domain experts from various disciplines or general audience to MAKE SENSE and PRESENT their data, for decision making. Techniques and knowledge from different sub-fields of computer science (including computer graphics, image processing, data structures and algorithms, high performance computing, machine learning, and human-computer interaction), mathematics, cognitive and perception science, and specific application domains are often adapted for various visualization problems. This introductory course covers topics from a number of sub-fields of visualization and aims to show students how data visualization can help find solutions to a wide range of practical data interpretation problems arising in many areas. Through this course, students are expected to (1) get familiar with important concepts, principles, and techniques/methods for the visualization of different types of data, and (2) foster the ability to select the proper visualization techniques when given a practical data visualization problem.
-
Prerequisites:
You are expected to have basics knowledge on linear algebra, linear systems, calculus, geometry, numerical analysis, and programming languages. Homework assignments and course projects will require knowledge and experience of C++ and/or Python. Visualization Toolkit (VTK) will be used with either C++ or Python to complete the programming assignments. You need to have solid grasp of data structure and algorithm design. Minimal familiarity with computer graphics principles and techniques is assumed. Having taken COSC 6372: Computer Graphics is ideal but not required.
-
Textbooks: (NOT required)
Visualization techniques are highly application dependent and highly diversified! There is currently no a good texxtbook that can summarize all available techniques. However, the following textbooks provide a good introduction to some well-established techniques for a number of fundamental visualization problems.- Data Visualization: Principles and Practice. Second Edition. Alexandru C. Telea, A.K. Peters, 2014.
- Introduction to Information Visualization. Riccardo Mazza, Springer, 2009.
- Charles D. Hansen and Chris R. Johnson, Visualization Handbook, Elsevier, 2004.
- Storytelling with Data. Cole Nussbaumer Knaflic, Wiley, 2015.
-
Grading:
- Assignments – 20%
- Exams – 40%
- In-class quizzes – 15%
- Final project – 25%
A student needs to score on average at least 60% in total to pass the class.
Grading scale (tentative): A:>92%; A-: >88%; B+: >84%; B: >80%; B-: >74%; C+: >68%; C: >60%.
Lecture Slides
|
Timeline |
Lectures |
Additional
Reading Materials and Resources |
|
Week 1 (08/22, 24) |
Introduction [slides] Visualization pipeline [slides], data types [slides] |
|
| Week 2 (08/29, 08/31) |
Cognition and perception, what need to be considered
[slides]
Colors in visualization [slides] |
|
| Week 3 (09/05, 07) |
VTK introduction [slides] Please follow the instructions to install the VTK and PyQT environment for the programming assignments. Note you will need to first install Python 3.10 .
2D scalar field visualization - color plots [slides] ( Assignment 1 out ) [Check the Assignments tab] |
VTK resources:
|
| Week 4 (09/12, 14) |
2D scalar field visualization - iso-contouring
[slides] 3D scalar field visualization - iso-surfacing [slides] 3D scalar field visualization - DVR - Raycasting [slides] |
|
| Week 5 (09/19, 21) |
3D scalar field visualization - DVR - Raycasting (continued)
[slides] 3D scalar field visualization - DVR - Splatting [slides] (Assignment 2 out) Transfer function design - principles and practices [slides] |
|
| Week 6 (09/26, 28) |
Exam 1 Final project introduction [slides] |
|
| Week 7 (10/03, 05) |
2D vector field visualization - introduction, streamlines
[slides] 2D vector field visualization - texture-based [slides] |
|
| Week 8 (10/10, 12) |
2D vector field visualization - Feature-based (phyiscal features)
[slides]
(Assignment 3 out) 2D vector field visualization - Feature-based (topological features) [slides] |
|
| Week 9 (10/17, 19) |
3D vector field visualization
[slides] Extra coding activities (Assignment 4 out) |
|
| Week 10 (10/24, 26) |
Unsteady (time-dependent) flow visualization
[slides] Tensor field visualization – overview [slides] |
|
| Week 11 (10/31, 11/02) |
Tensor field visualization - Glyph-based technique
[slides] Tensor field visualization – Geometric-based, texture-based, and topology-based methods [slides] |
|
| Week 12 (11/07, 09) |
Information visualization – graph and hierarchy data visualization I
[slides] Information visualization – graph and hierarchy data visualization II [slides] |
|
| Week 13 (11/14, 16) |
Information visualization – elementary plotting
[slides] Exam 2 |
|
| Week 14 (11/21, 23) |
Higher-dimensional data visualization -- overview
11/23 Thanksgiving Holiday! No Class! |
|
| Week 15 (11/28, 11/30) |
Final project presentation
|
|
Assignments
VTK and PyQT installation instructionsPython 3.10 will be required for the following programming assignments due to the potential incompatibility issues of VTK library with newer versions of Python. So please to ensure to install Python 3.10 first before the following steps
- For Windows systems, please follow this instruction and download this file.
- For Mac and Linux systems, please follow this instruction and download this file instead!
VTK demo program (use the data set of Assignment 1 below)
-
Assignment 1: 2D scalar field visualization - color plots, isocontouring
[description]
[data]
[skeleton code]
(Due on 09/18/2023)
-
Assignment 2: 3D scalar field visualization - cut planes, isosurfacing, and volume rendering
[description]
[data]
[skeleton code]
(Due on 10/09/2023)
-
Assignment 3: 2D vector field visualization - arrow plots, streamlines, and LIC
[description]
[data]
[skeleton code]
(Due on 10/19/2023)
-
Assignment 4: 3D steady vector field visualization - arrow plots, streamlines, and stream surface
[description]
[data]
[skeleton code]
(Due on 11/6/2023)
Final Projects
Final Project Proposal (Due on October 20 (10%))
Please submit a final project proposal to Canvas. Your proposal should include the following information- Title or topic that you are going to work on
- A brief description of the problem. What visualization problem(s) do you try to address? Any tentative solution? What platform, library, and programming language are you planning to use?
- Team members -- who will be on your team and their respective roles (who do what?)
- A tentative strategy to address the problem -- this can be some techniques you learned from the class or reported in some papers. Please do provide a list of references
- A tentative timeline -- what are the individual milestones of your project
Final Project Presentation on ( November 28 and November 30 (30%) Peer-grading)
Your delivery should be a visualization system (web browser-based or standalone), not just a set of plots and charts or images! Your presention should include the following components- Problem definition (especially what is the visualization problem you are addressing)
- Describe your technique (mostly on algorithm and visualization/interface design) Briefly describe who (which member) did what
- Results and/or demo (Show your current results. Provide necessary interpretation of your visualization. How do you know you have resolved the problem?)
- Future Work (If your results are half-cooked, what else do you still need to do to make it complete before the deadline? If the results are ready/finalized, what do think you can improve further in the future)
Final Report ( Due on December 4 (60%))
Your final report should be written in the IEEE TVCG style (at least 4 pages double-column including figures and illustrations). You can find the template (in words or Latex) of this format in the following link.https://www.computer.org/web/tvcg/author
Your report should include the following components. A report not including ALL the following components and/or not following the suggested IEEE double-column format will result in the loss of points . Also, please remember your delivery should be a visualization system (web browser-based or standalone), not just a set of plots and charts or images!
- Title, List of Authors, and Abstract
- Introduction
- Related Works
- Methodology and Implementation (include necessary flow charts and pseudo-code, more importantly, details of each member's contributions!!!)
- Results and Discussion (make sure you interpret your visualization and results, and provide meaningful discussion)
- Conclusion and future work (make sure you describe the limitations of the current implementation)
If you already have a research topic with a faculty and there is a clearly defined visualization problem in your research, please talk to me to see whether it will make a qualified final project for the course. Otherwise, please choose from the following options.
Final Project Options (for your reference)
- Real-time volume rendering and semi-automated transfer function design
-
Streamline placement on curved surfaces or in 3D volume
- Benjamin Spencer, Robert S. Laramee, Guoning Chen, and Eugene Zhang. Evenly-Spaced Streamlines for Surfaces: An Image-Based Approach
- Lieyu Shi, Robert S. Laramee, and Guoning Chen, Integral Curve Clustering and Simplification for Flow Visualization: A Comparative Evaluation
-
Effective visualization of dense 3D lines
- Sebastian Eichelbaum, Mario Hlawitschka, and Gerik Scheuermann, LineAO—Improved Three-Dimensional Line Rendering
- Tobias Günther, Christian Rössl, Holger Theisel, Opacity optimization for 3D line fields
-
Stream surface placement in 3D volume
- Matt Edmunds, Robert S. Laramee, R. Malki, I.Masters, T.N. Croft, Guoning Chen, and Eugene Zhang. Automatic Stream Surface Seeding: A Feature Centered Approach
- Yuan Chen and Jonathan D. Cohen, Similarity-Guided Streamline Placement with Error Evaluation
-
3D vortex extraction
Ming Jiang, Raghu Machiraju, David Thompson. DetectionandVisualizationofVortices -
2D vector field topology extraction and visualization
Guoning Chen, Konstantin Mischaikow, Robert S. Laramee, Pawel Pilarczyk, and Eugene Zhang. Vector Field Editing and Periodic Orbit Extraction Using Morse Decomposition -
Glyph packing for tensor field visualization
Gordon Kindlmann and Carl-Fredrik Westin. Diffusion tensor visualization with glyph packing -
Large-scale and dynamic graph visualization
- Pavel Govyadinov, Tasha Womack, Jason Eriksen, David Mayerich, and Guoning Chen, Graph-assisted Visualization of Microvascular Networks
- J. F. Kruiger, P. E. Rauber, R. M. Martins, A. Kerren, S. Kobourov, A. C. Telea, Graph Layouts by t-SNE
-
Visualize cybersecurity related data
This is a project proposed by Dr. Yunpeng Zhang from the Department of Information and Logistics Technology.
The following are two candidate data sets for this project.
- KDD Cup 1999 Data. This database contains a standard set of data to be audited, which includes a wide variety of intrusions simulated in a military network environment.
- UNSW-NB15 Computer Security Dataset was created by the IXIA PerfectStorm tool in the Cyber Range Lab of UNSW Canberra for generating a hybrid of real modern normal activities and synthetic contemporary attack behaviours.
A visualization technique has been developed to show this data which you may refer to for your final project. You can find a description of this technique in this paper. -
Visualization Contests
If you are not interested in any of the above topics, you may also choose from one of the past (and current) visualization contests below, which offers a wide variety of data visualization problems.
All SciVis Contests
Visual Analytic Science and Technology (VAST) challenges -
FCLWebVis an online web-browser scientific data visualization platform
This is a project proposed by Dr. Guoning Chen. The purpose is to set up an online Scientific Data visualization platform to facilitate the deployment of newly developed visualization techniques. The prototype of the system is almost ready for release. The task here is to improve the user interface, local web-browser based visualization, and adding new tasks/services to the platform. [a reference paper] -
Effective visualization of 3D cross/frame fields
- Xifeng Gao, Wenzel Jakob, Marco Tarini, Daniele Panozzo. Robust Hex-Dominant Mesh Generation using Field-Guided Polyhedral Agglomeration . -
Ensemble data visualization
- Potter, Kristin, Andrew Wilson, Peer-Timo Bremer, Dean Williams, Charles Doutriaux, Valerio Pascucci, and Chris R. Johnson. Ensemble-vis: A framework for the statistical visualization of ensemble data .
- Marc G Genton, Christopher Johnson, Kristin Potter, Georgiy Stenchikov, Ying Sun. Surface Boxplots .
- Mahsa Mirzargar, Ross T. Whitaker, and Robert M. Kirby. Curve boxplot: Generalization of boxplot for ensembles of curves .